Events
Agents report security events to the Portal's Event page. These events provide security information and are triggered by rules. Rules can be created or adapted to track your specific security activity.
Events Overview
Here you can view the historical events, monitor real-time events, and search all events matched with the specified pattern. The donut charts and pie charts can be filtered by time using the dropdown menu at the top of the page. You can adjust this selection to visually compare the number of security events across a specified window of time (last 24 hours, 7 days, 30 days). The interactive bar chart additionally allows you to drill down into a specific hour view e.g. you can filter the page to the last 24 hours and then click on the 15:00 bar for details on all events from 15:00 - 15:59.
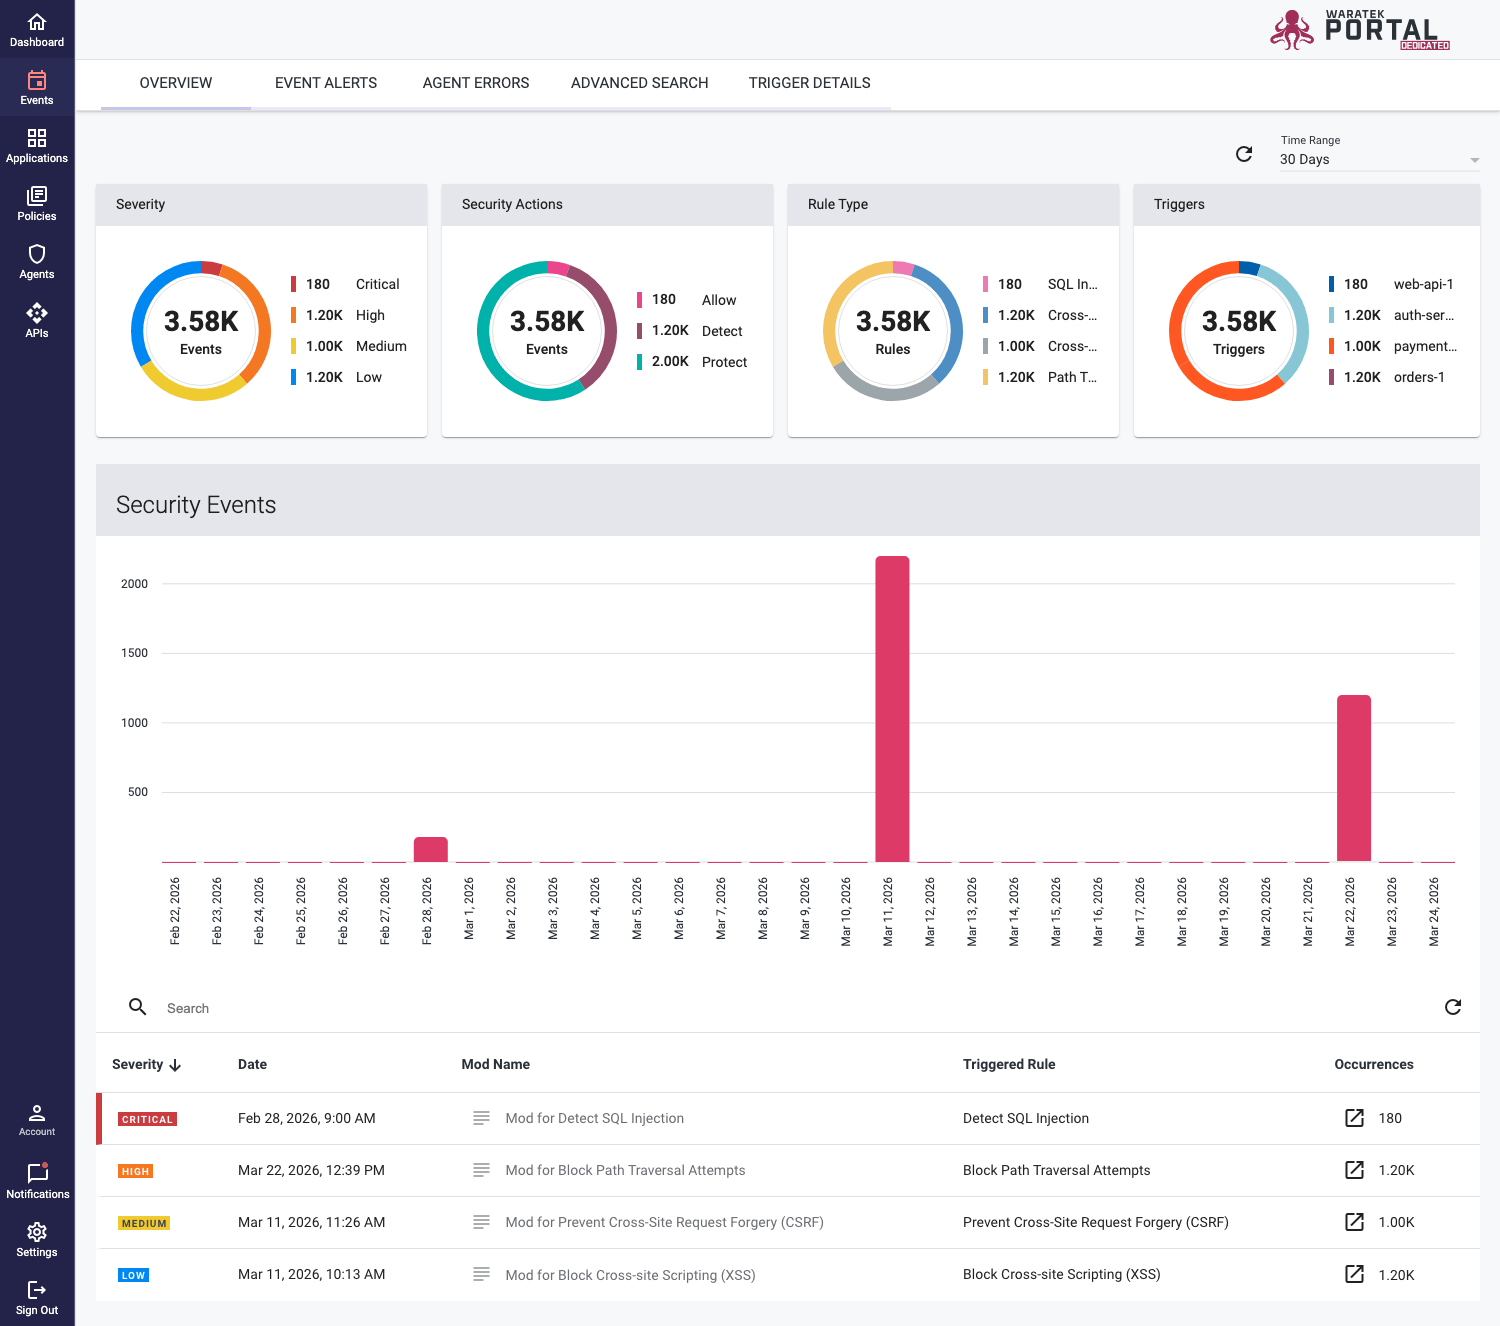
In the security events table below the chart, a detailed list of the events from the chart timeline is provided. This table details the event properties including the severity of the event, the application, and rules that are triggered, the date and time it occurred, and the number of occurrences.
In this table, the Agent reporting the events is displayed in a column as an icon link  . Clicking on this link will take you to the Agents page where you can get further details on the Agent.
Clicking on the Mod icon  will take you to the Mod Details page that contains the triggered rule. This page shows what other rules are contained within that Mod; you can directly edit the mod and add or remove rules here.
Editing the Mod is useful in scenarios where a rule is very noisy and produces large numbers of events. You can add whitelist rules to work with the triggering rule to fine-tune the Mod and cut down on unwanted noise in the Security Events table. More information on the Mod Details page can be found on the User Guide's Policies page.
Clicking on the Occurrences icon  will open the Advanced Search tab which will be auto-filtered to list all events that have been triggered for that specific time, Agent, Mod, and Rule.
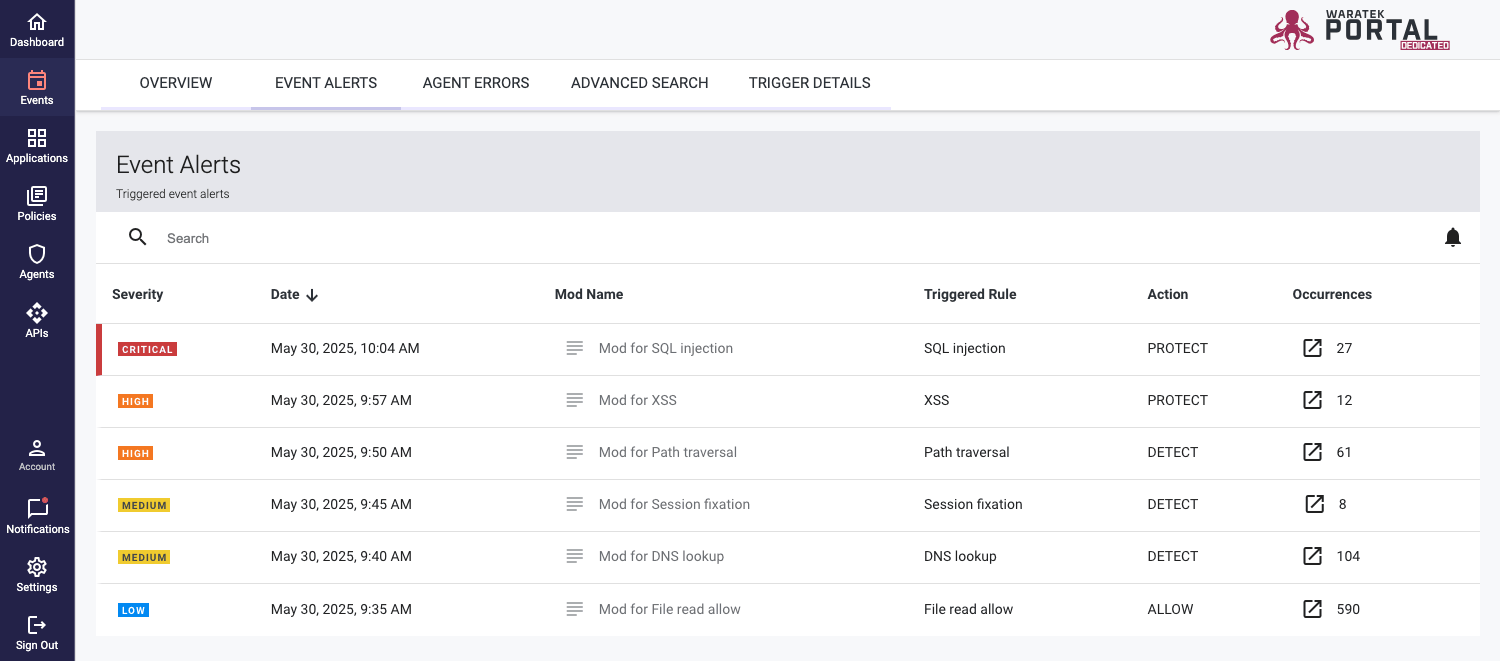
Event Alerts
This tab lists the Event Alerts which have been triggered based on the event notification settings. It is a useful resource when rules and whitelists have been implemented as any event listed in that scenario would need attention.
More information on these notification settings can be found on the User Guide's System Settings page.
Agent Errors
An Agent Error event can occur when an unsupported Mod is sent to the Agent. These events usually require some action to be taken, such as modifying the Mod based on the error message reported by the agent. See the Agent's User Guide for further details.
Clicking on the Agent icon beside the agent name will open the agent details page where, under the Events tab, the full list of lifecycle events for that agent can be viewed. This tables lists the lifecycle error events that were reported by agents in the last 7 days. A maximum of 1000 error events are included in the table. The errors will be listed in the table until the rule is successfully loaded by the Agent or until the date range is exceeded
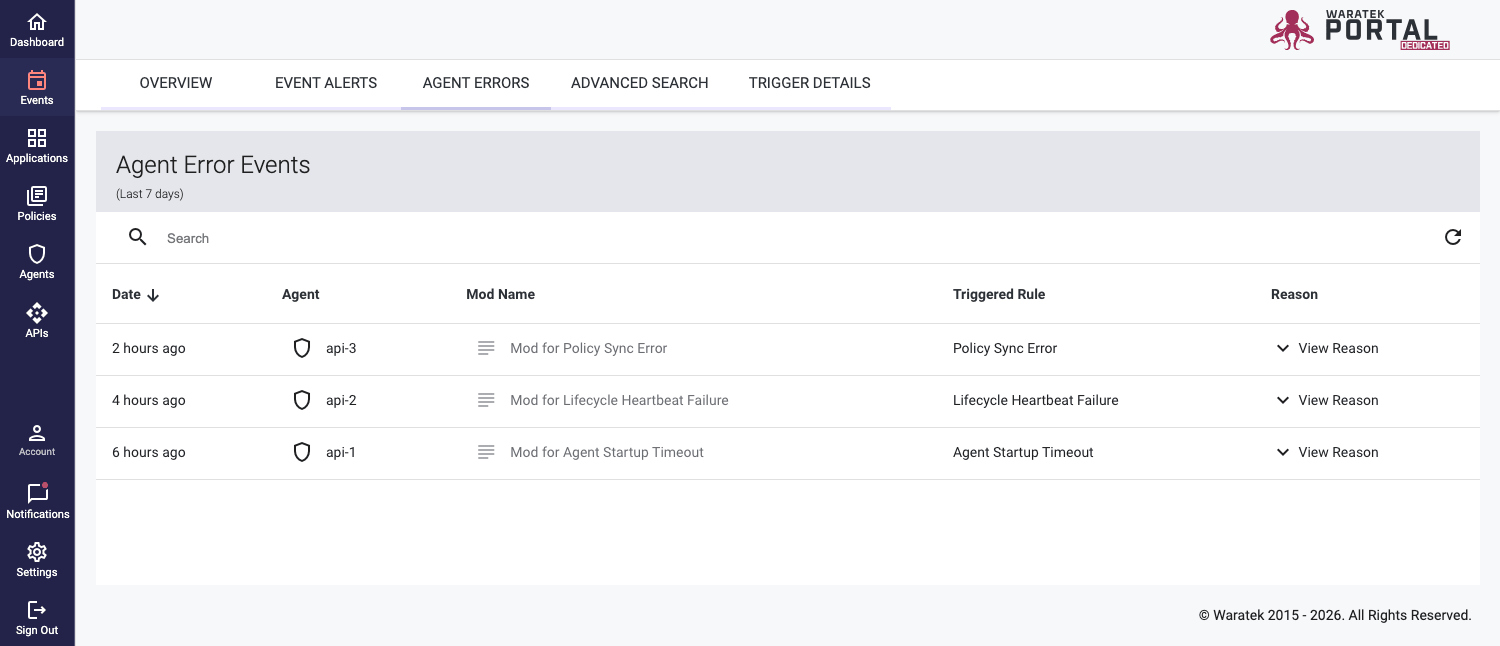
An Agent specific report is available on the the Agent Lifecycle Events table (found under Agents tab → Select specific Agent icon → Events Tab)
Advanced Search
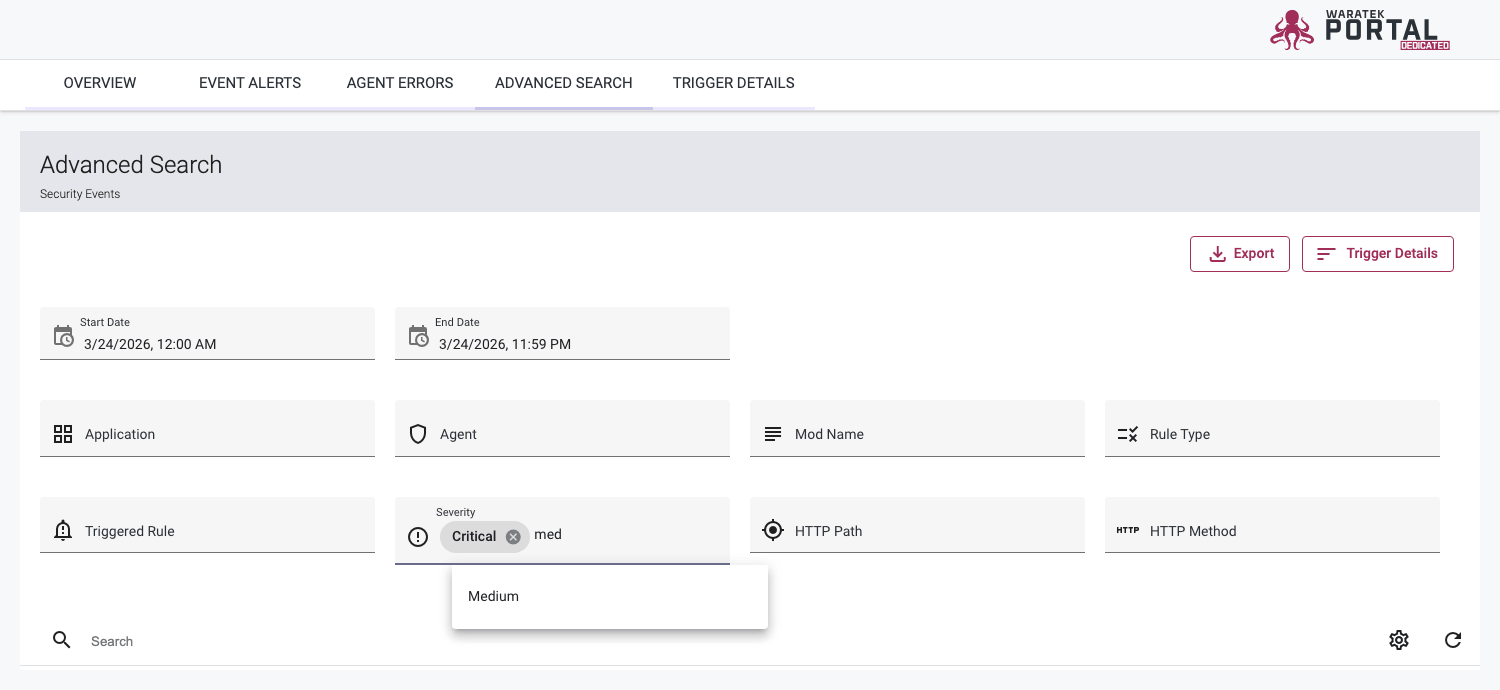
To access the Advanced Search Page, select the Advanced Search tab in the sub-navigation bar at the top of the screen. The Advanced Search helps you to isolate individual events easily from the Portal's event records. Events listed can be narrowed using multiple filters. Columns can be added/removed from the Advanced Search table by clicking the settings icon  in the searchbar at the top of the table. A dropdown menu will appear to allow you to select which columns you would like to appear in the table.
Any event's stack trace and metadata information can be revealed by clicking on the Stack Trace  and View Details
  buttons on the table row. The trigger list can be copied from the table by selecting the copy all
  button at the top of the column. If desired, you can also export your filtered table results, including metadata, to a .csv file by selecting the Export button.
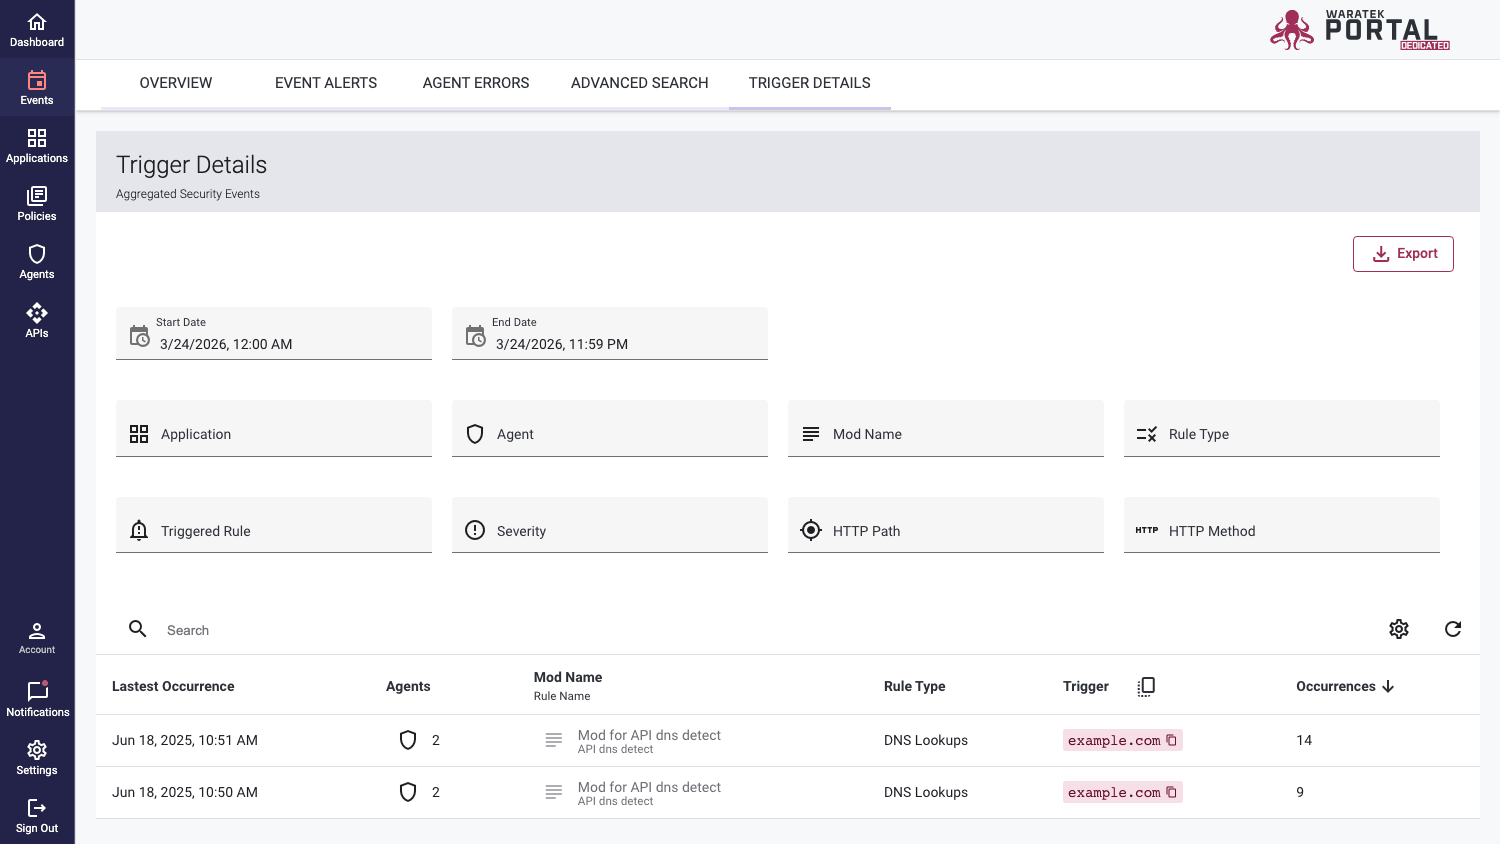
Trigger Details
A trigger is based on a runtime event that comes from an Agent. When an application event occurs that matches the conditions created in a rule, the event will trigger the rule and the user-defined security actions will be performed.
The Trigger Details tab provides an aggregated view of the most common events and triggers that are occurring. Clicking on the Trigger Details tab in the sub-navigation bar will open up the Trigger Details table. The events in this table can be narrowed by keyword in the searchbar and/or by applying the following filters:
- Start and End Date
- Application
- Agent
- Mod Name
- Rule Type
- Triggered Rule
- Severity
- HTTP Path
- HTTP Method
As with the Advanced Search, you can add/remove columns from the table by clicking the settings icon in the searchbar at the top of the table. Your filtered results can also be exported to a .csv file by selecting the Export button in the top right of the card.
Event Errors
If the Portal cannot read events from the event datastore (Elasticsearch) a banner message is displayed on every page. During this time, security events cannot be viewed in the Portal. This error may occur for a range of reasons and further investigation is required to determine the cause of the communication failure. Once communication is restored, the banner message will automatically be removed and security events will again be viewable in the Portal.
![]()
A banner message will also be displayed if agents fail to send events to the event datastore (Elasticsearch). During this time, security events may not be logged to the event datastore by the affected agents. These agents will continue to buffer events in memory and log events to the local security log file. Once communication is restored, the buffered events may be written to the datastore (depending on the duration of the outage) and the banner message will automatically be removed in the Portal.
![]()