Stack Trace
Stack traces are useful for debugging vulnerable applications with a great degree of accuracy. The output can however be quite verbose, and the stack trace feature does not apply to all rule types.
When a Waratek Agent detects an attack, a stack trace can pinpoint the exact line of code that is vulnerable.
The following rule models support the stack trace feature:
-
Cross-Site Request Forgery (CSRF)
-
Cross-Site Scripting (XSS)
-
Deserialization of Untrusted Data
-
DNS Lookups
-
File Read/Write
-
Improper Input Validation
-
Library Loading
-
Open Redirection
-
Path Traversal
-
Process Forking (Command Injection)
-
Socket - Accept
-
Socket - Bind
-
Socket - Connect
-
SQL Injection
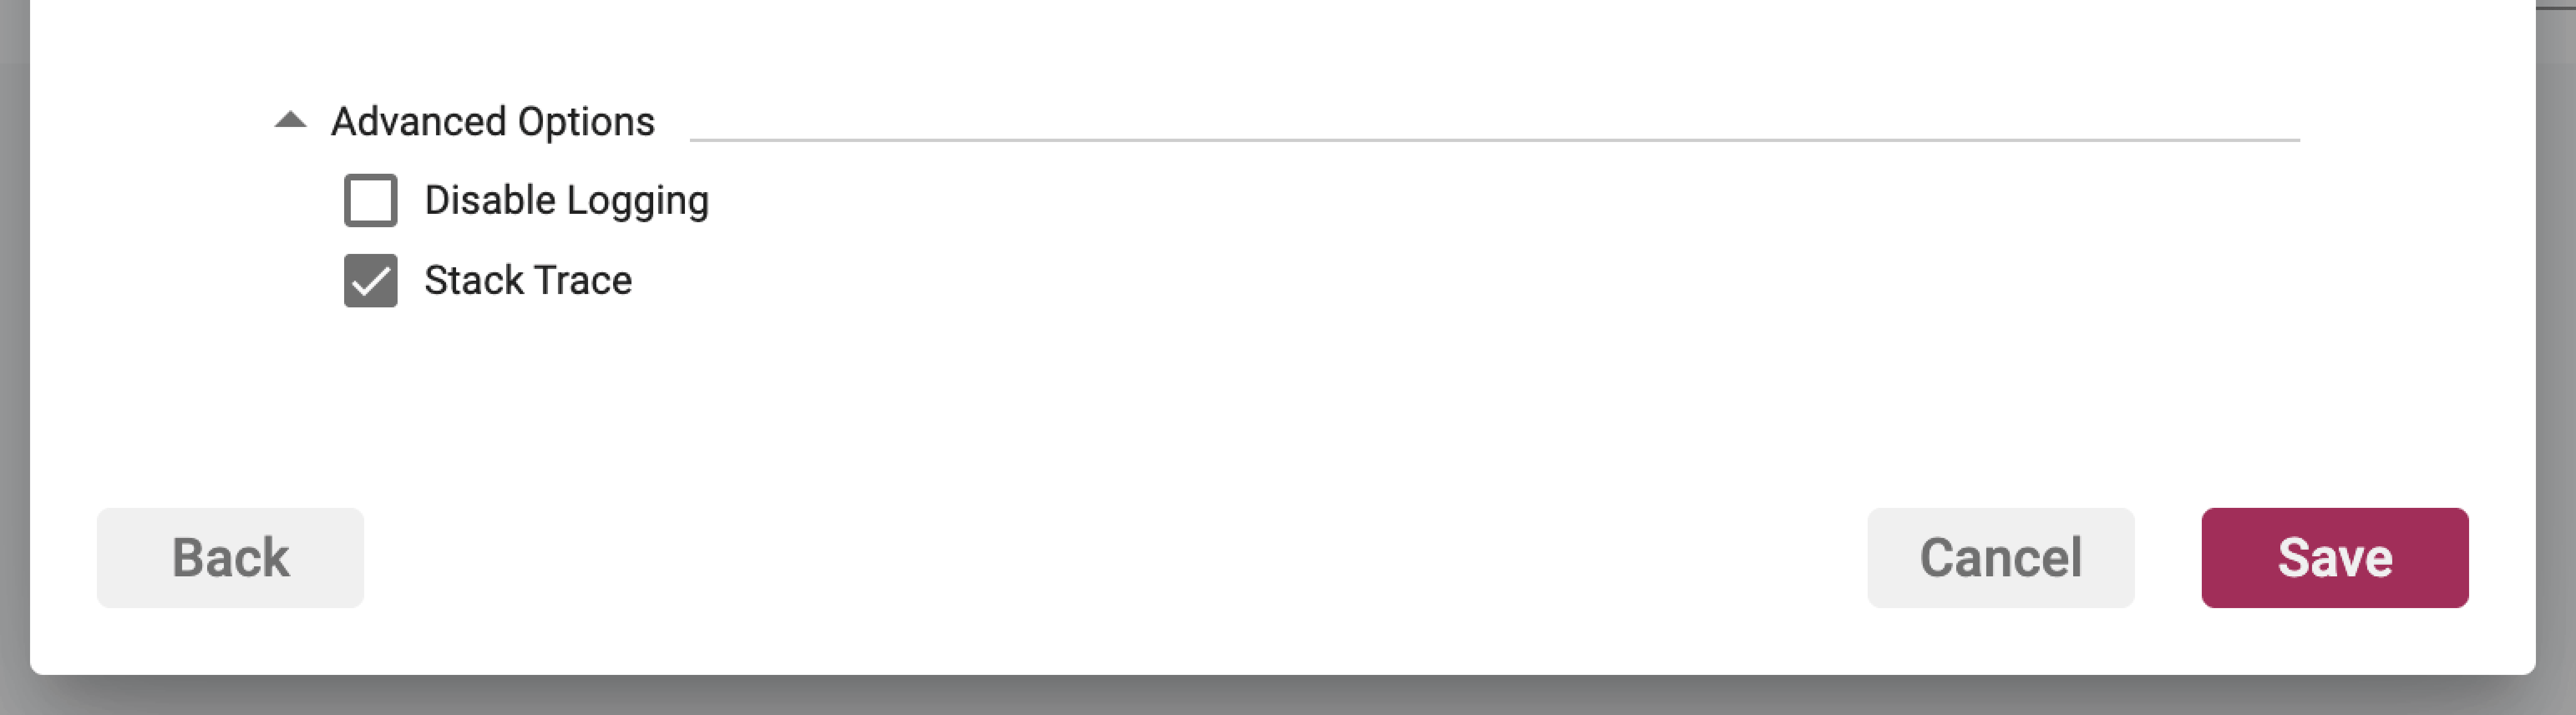
The stack trace feature toggle is available for each of the above rules within the Rules Wizard in the Advanced Options section. When you expand the Advanced Options section the option will be there, if the rule supports it. If the Disable Logging option is selected in this section, then the stack trace option will be disabled and unavailable.
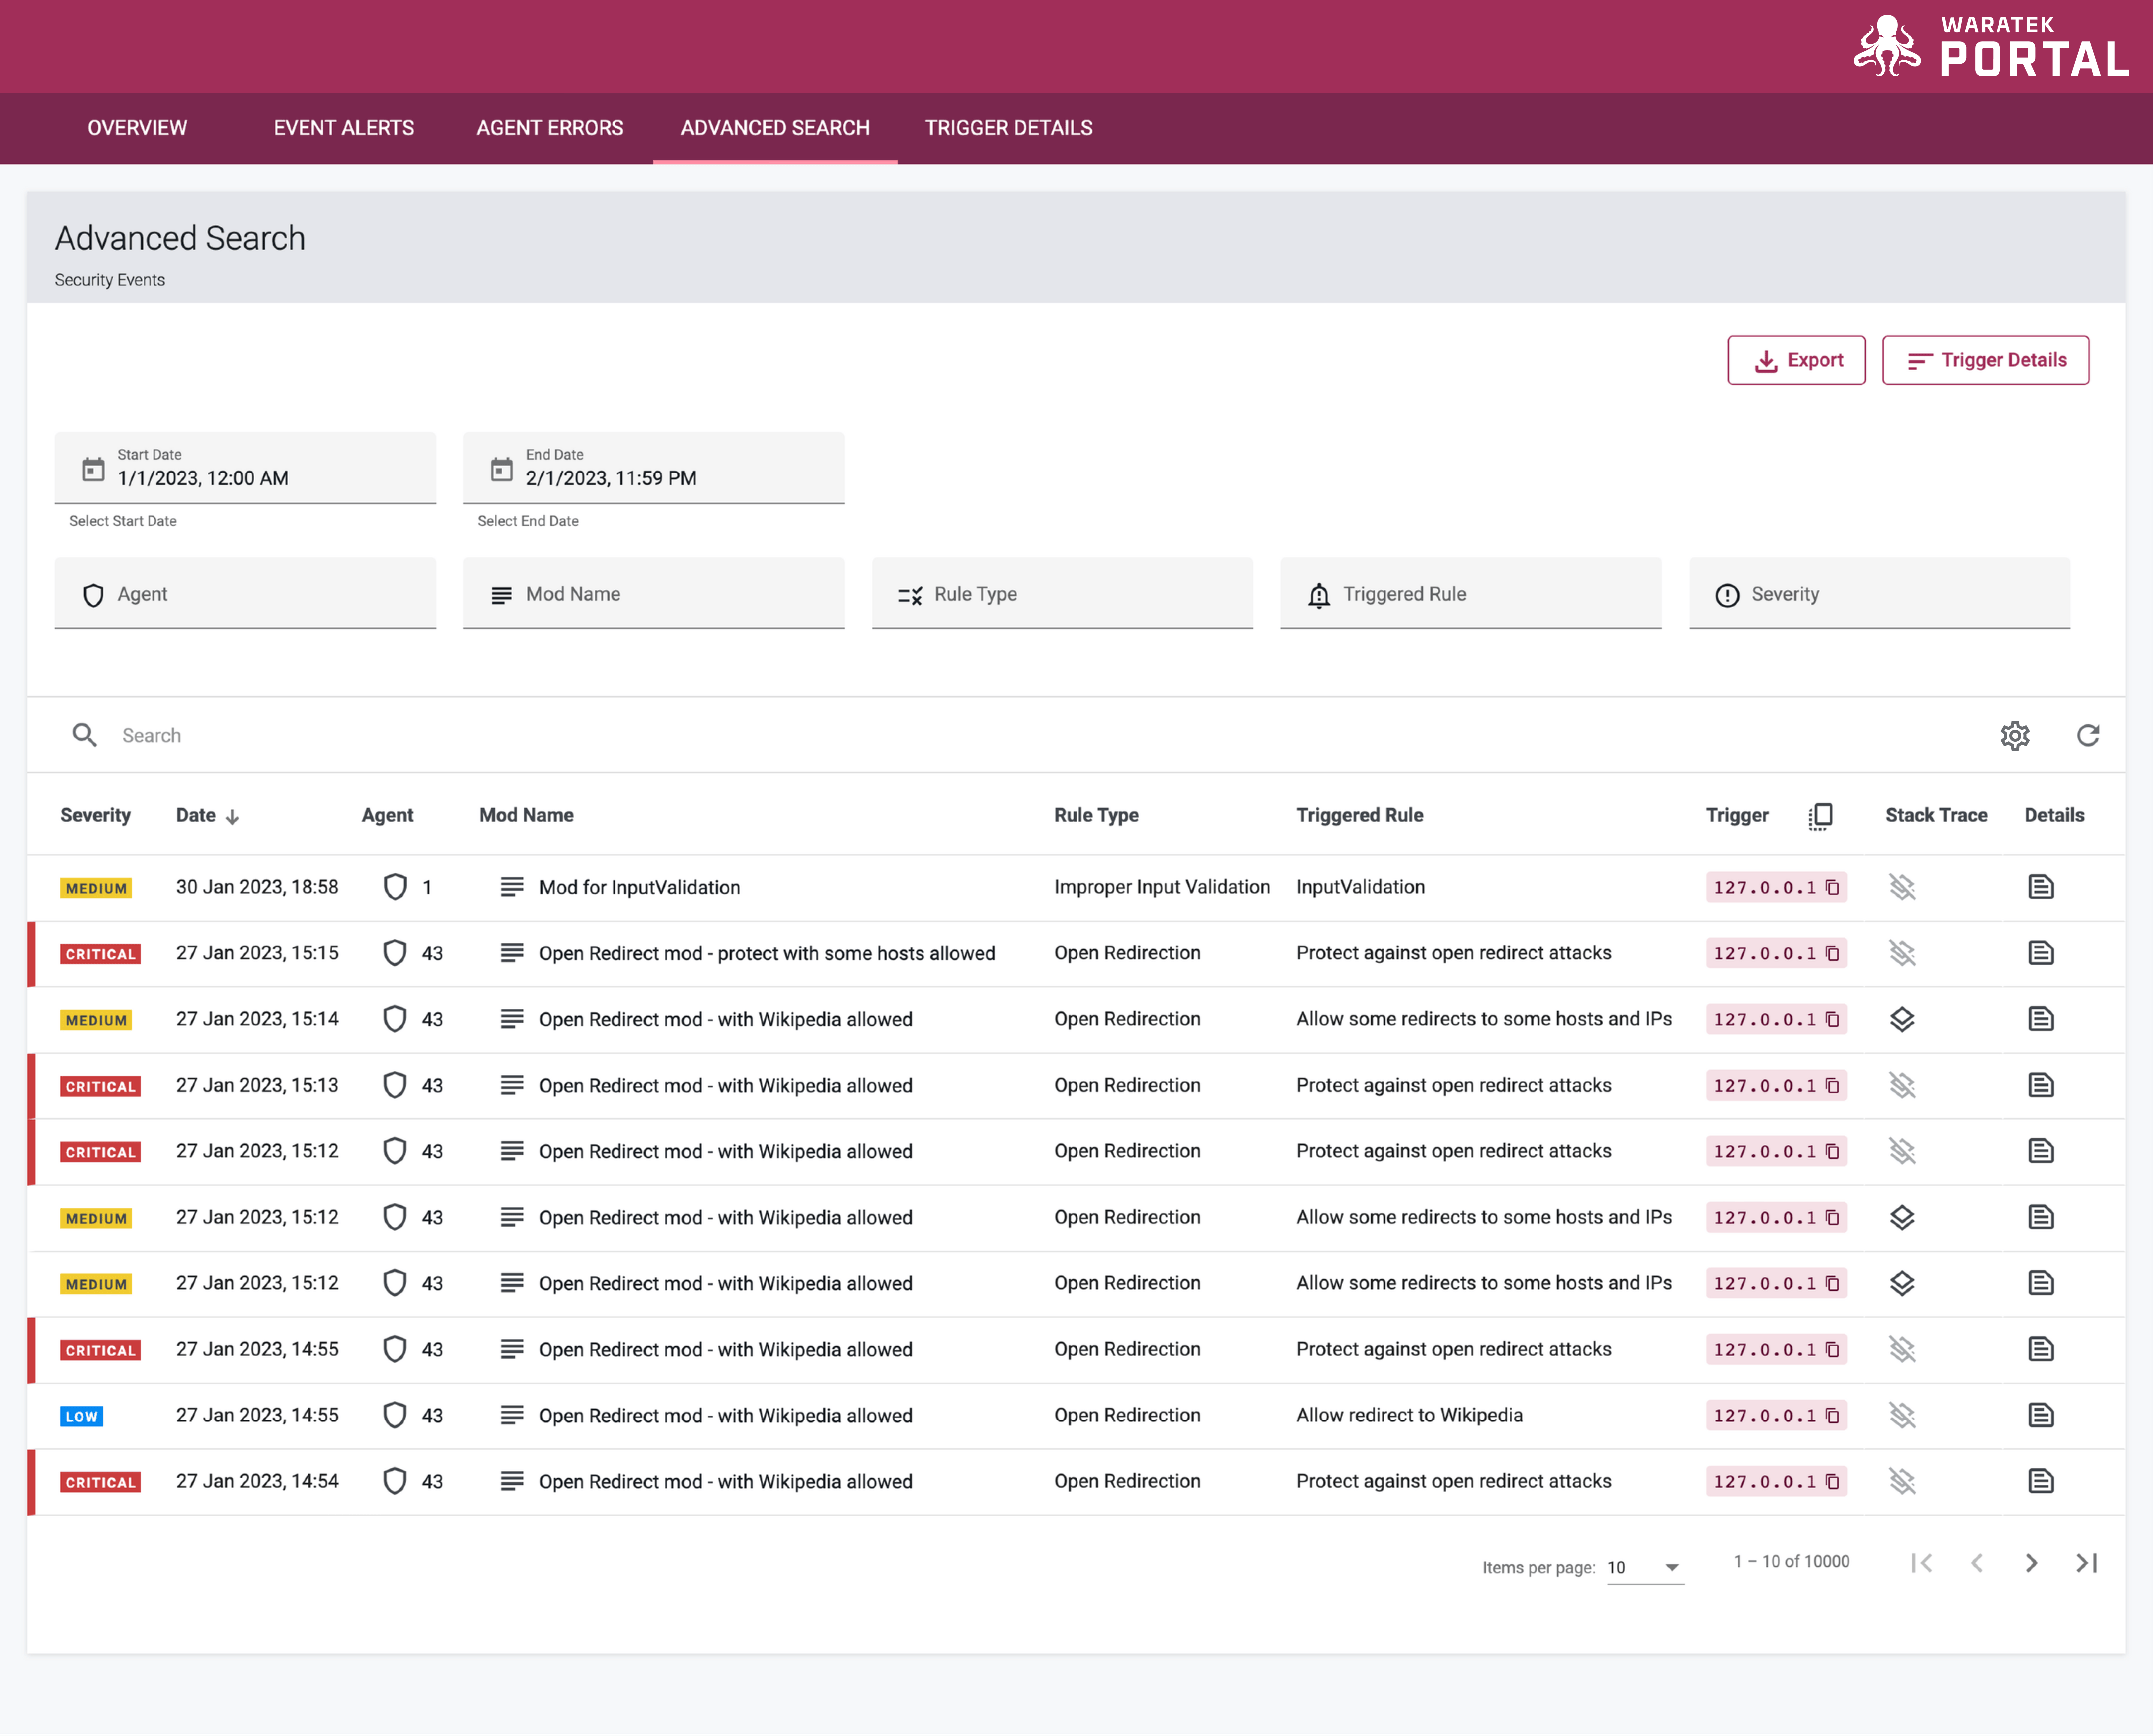
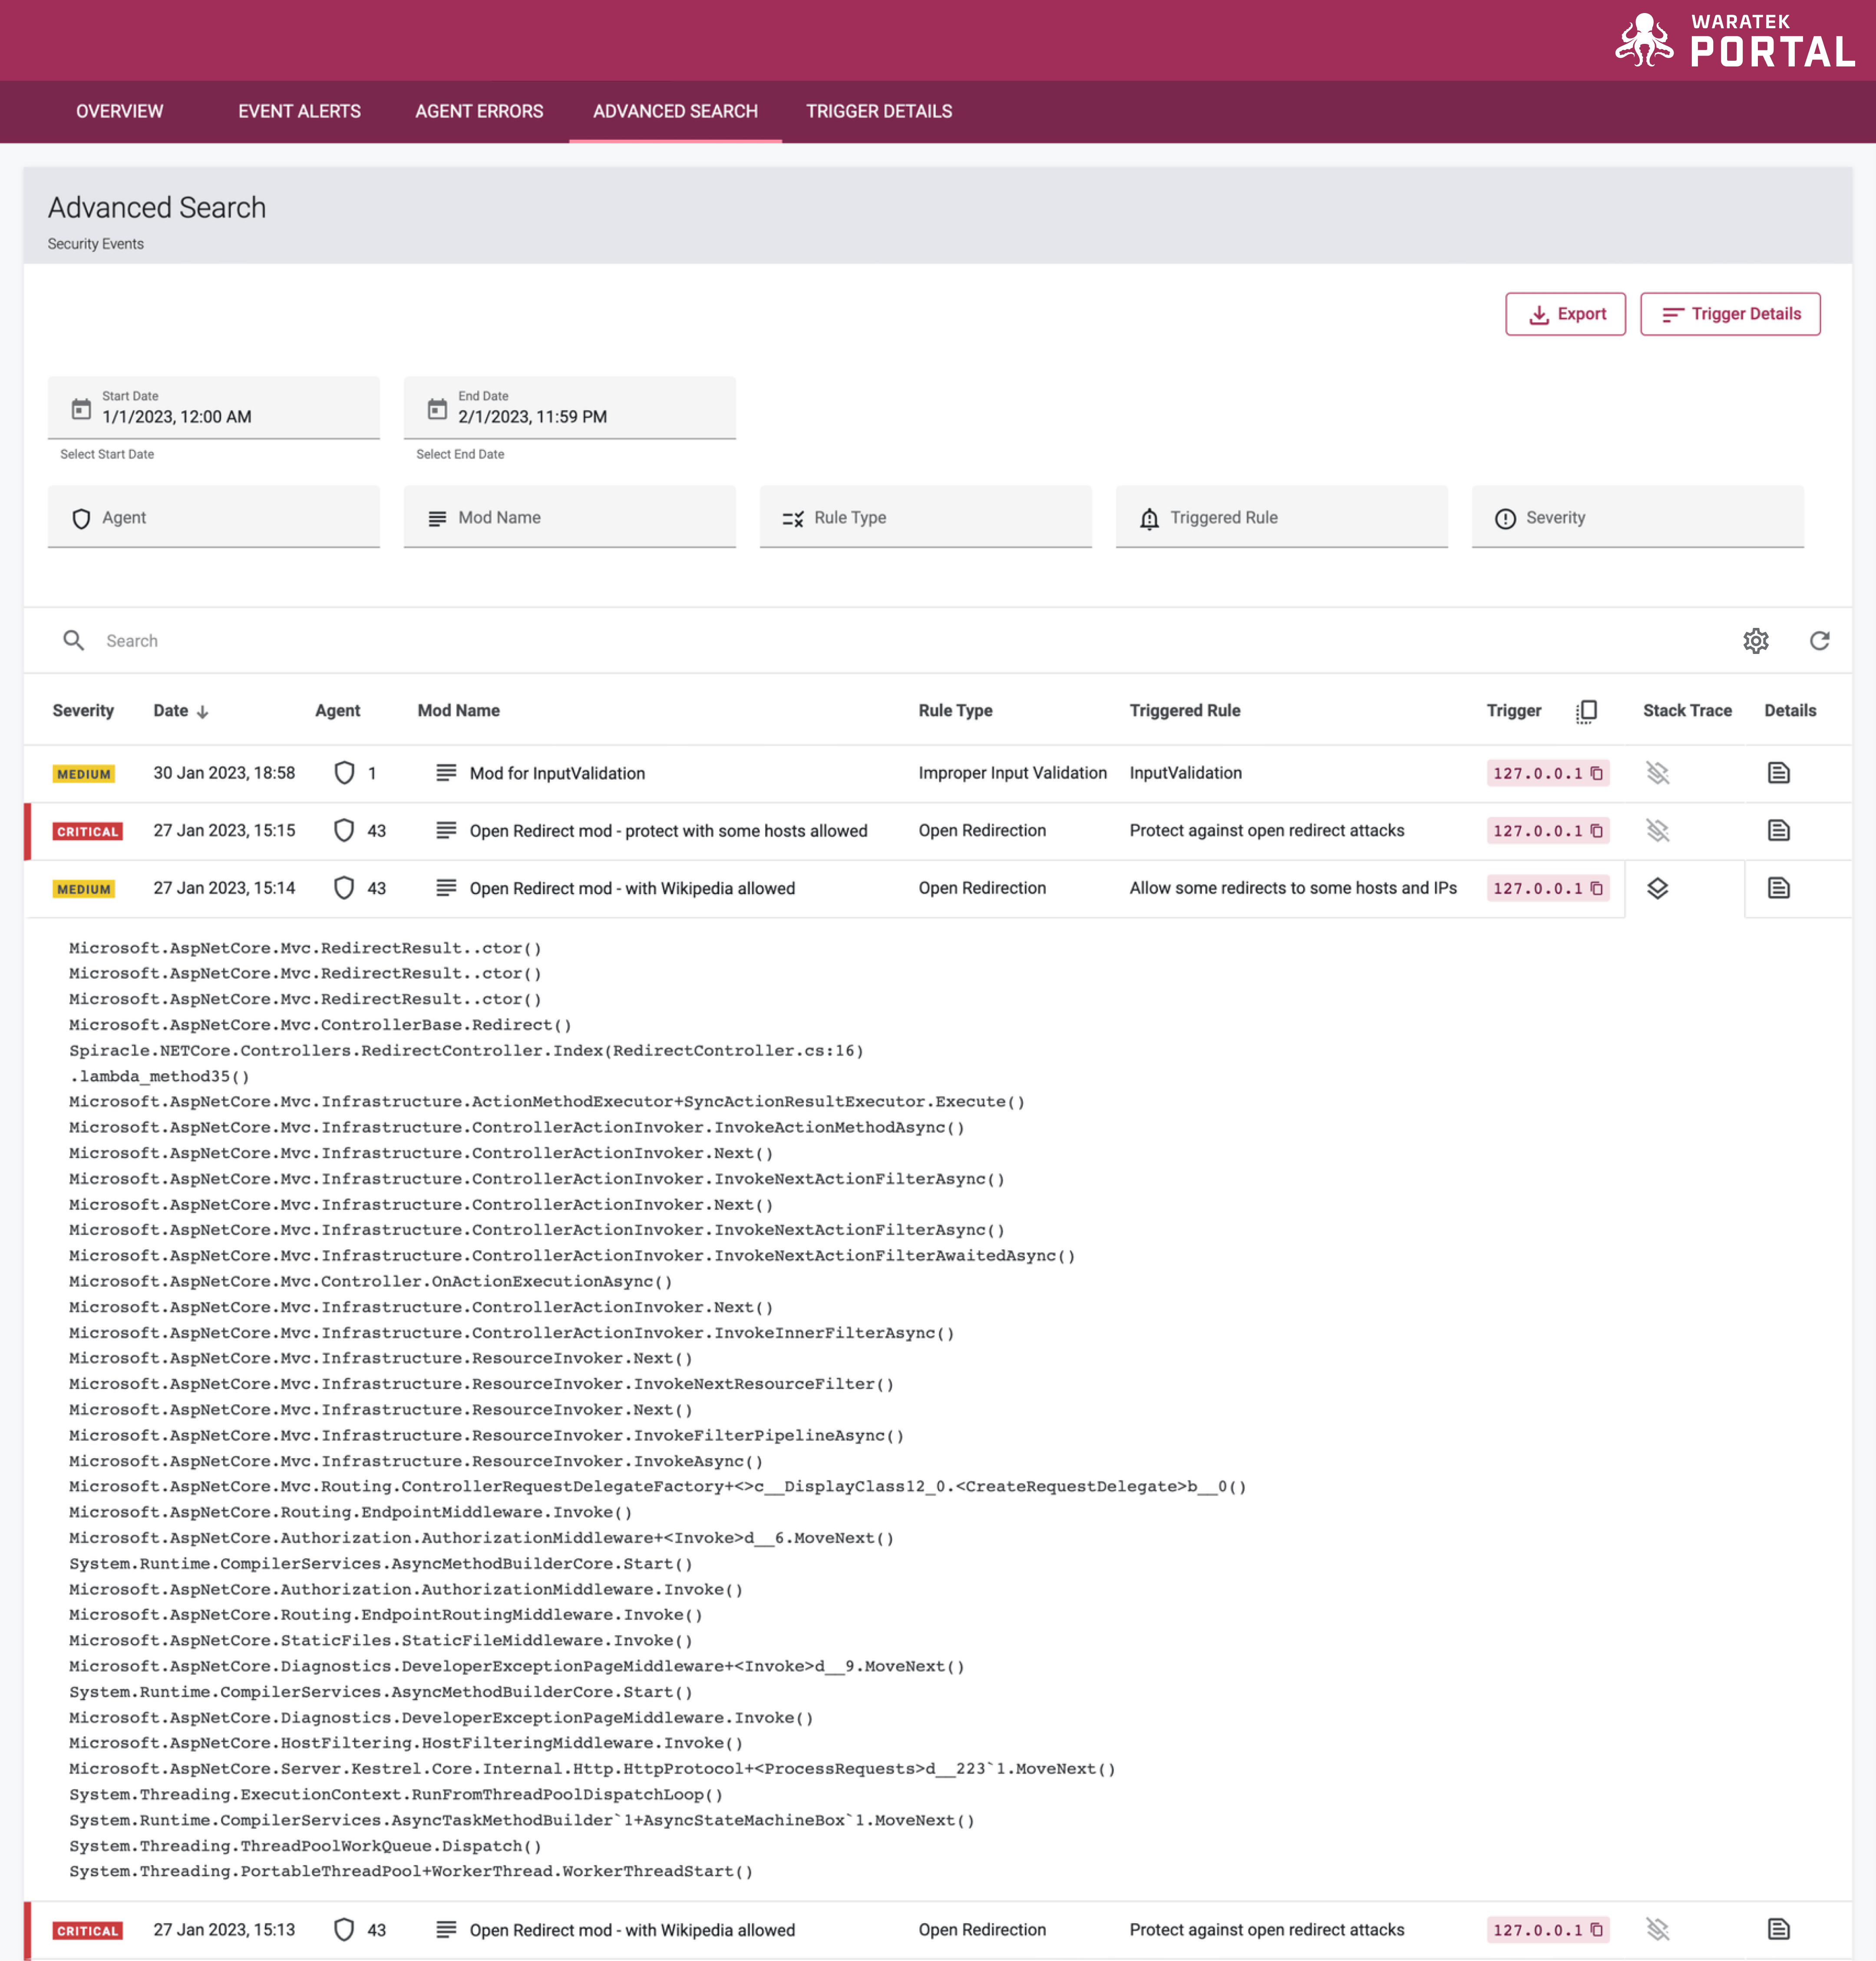
When a rule is triggered and a stack trace is created, a Stack Trace icon  will appear next to the individual events in the Advanced Search table. When you click on the Stack Trace icon on an event row, the stack trace will appear in an expanded view below the row, with the standard event log details included.